Browse categories
Explore
Fiverr Pro
English
$
USD

I am Swambika, and I have more than 5 years of experience working with Fortune 500 companies to improve their quality, performance, and customer experience utilizing data.
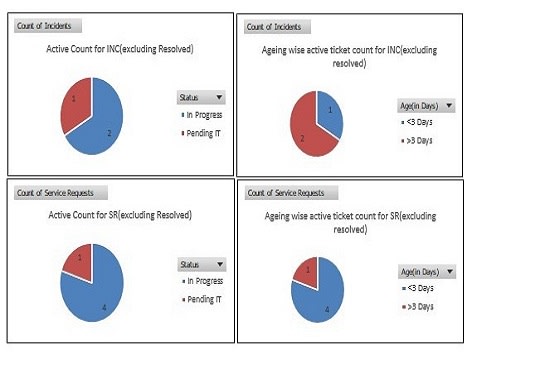
I can do any type of data analysis and data visualization creating pivot tables, charts, power pivot, interactive Real Time dynamic dashboards, and Reports.
How to order :
1. Let me know what you want (concept idea, reference, font and color specification do you want)
2. Chose your packages or with a custom offer
3. After you make order, I will make a rough chart/graph for the concept.
4. If you want to request modification or revision, please let me know
5. If the chart/graph idea is finalized, I will continue with the task.
You can request more modifications, only for colors, shapes or maybe element that need to be added (modifications not to be change the concept)
I will 100% deliver the project on time
Languages
Do you have enough expertise for data visualization?
I am working only data visualization-related job for many years.
Do you provide extra fast delivery?
100%! Most of the time I deliver projects far before the deadline so that you can scrutinize everything.
Do you make presentative slides for my report?
Yes, I make slides in Microsoft PowerPoint for an extra $10.