Browse categories
English
$
USD
Connect to your AI

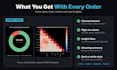
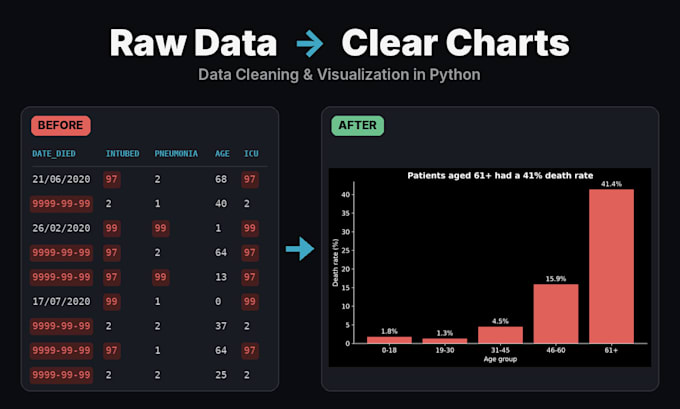
Raw data is often messy: missing values, duplicates, inconsistent formats and codes that dont make sense at first glance. Before it can tell you anything useful, it needs to be cleaned properly. Thats exactly where I come in.
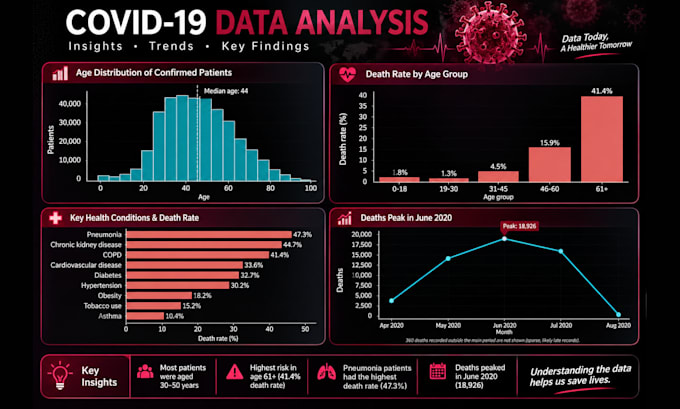
Ill take your raw dataset, clean it carefully, and turn it into clear, professional charts that highlight what really matters. Every chart comes with a title that states the key insight, so you or your audience can understand the story behind the numbers at a glance.
With every order, youll receive:
I work with Python (Pandas, Matplotlib, Seaborn) and accept CSV, Excel and TXT files.
Please note that I focus on static charts and graphs. I dont build dashboards or interactive visuals.
Feel free to message me before ordering. Im happy to look at your data and recommend the package that fits your needs best.
Data Analyst Dashboards Excel Python
Languages
What kind of data can you work with?
Most structured data works well: sales records, survey results, customer lists, health data, financial records and more. If it’s in CSV, Excel or TXT format, I can clean it and visualize it.
What do you need from me to get started?
Just your data file and a quick note on what you’d like to learn from it. If you’re not sure what to look for, that’s fine. I’ll explore the data and suggest the most useful charts.
My data is really messy. Can you still help?
Yes, that’s exactly what I’m here for. Missing values, duplicates, inconsistent formats and unclear codes are all part of the cleaning process. I’ll also tell you what I changed so nothing is hidden.
Will my data be kept confidential?
Absolutely. Your data is used only for your order and is never shared with anyone. I delete it once the order is complete, unless you’d like me to keep it for future revisions.
. Do you create dashboards in Power BI or Tableau?
No. I focus on static, high-quality charts and graphs that you can use in reports, presentations or documents. If you need a dashboard, I’d recommend a dashboard specialist.
Can I choose the colors or style of the charts?
Of course. If you have brand colors or a preferred style, just let me know. I can also provide a white-background version that works well in Word and PowerPoint.