Browse categories
Explore
Fiverr Pro
English
$
USD


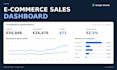
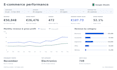
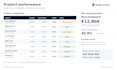
Turn your shop export into a Google Sheets ecommerce sales dashboard that shows what drives revenue, orders and margin.
I clean and structure your approved CSV, XLSX or Google Sheets data and calculate the agreed KPIs. Depending on your package and available data, these can include revenue, gross profit, orders, average order value, margin, monthly trends, category performance and product rankings.
You receive clear charts, useful filters, transparent cleaning and KPI logic, and a documented update process for the same data structure. A written guide or video is included according to package.
My portfolio demo uses 630 fictional order rows, with a management view and product analysis. It is a self-initiated example, not a client project.
Message me with your data source and the question you want the dashboard to answer. Unsure which KPIs to use? I can help you choose. Before you order, I review an anonymized data sample and confirm the scope, package, price and delivery time.
Google Sheets KPI Dashboard Designer
Languages
Should I contact you before ordering?
Yes. Start with your data source and the question you want answered. I can help you choose suitable KPIs. Before you order, I review an anonymized sample and confirm the scope, package, price and delivery time.
Which file formats do you accept?
CSV in UTF-8, an unprotected XLSX file, or a Google Sheet. The table should have one header row and one record per row. I do not work from screenshots, scanned PDFs or password-protected files.
Can you combine multiple files or tabs?
Basic includes one relevant table. Standard can include up to two source files and four relevant tabs when there is one stable, documented join key. More complex data needs a custom review.
Can you build automatic integrations?
Only in Premium and only after a technical precheck. It covers one stable recurring source plus one weekly report or threshold alert. Arbitrary APIs, real-time feeds, scraping, databases and multiple automation sources are not included.
Can I update the dashboard later?
Yes, when new rows keep the same columns and structure. Basic and Standard use a documented manual update process. Premium may include one prechecked recurring import.
What counts as a revision?
A revision is grouped feedback that adjusts the agreed dashboard within the confirmed scope. New KPIs, sources, pages, joins, logic or a changed data structure are additional work. Defects in the agreed delivery are fixed.
How do you protect my data?
Please anonymize the sample and remove unnecessary personal or sensitive information. Never send logins, passwords, payment data, IDs or health data. Only the minimum data needed for the agreed dashboard should be shared.
Which e-commerce KPIs can you include?
Depending on the fields available, I can include revenue, gross profit, orders, average order value, margin, monthly trends, category performance and product rankings. We agree every KPI and its calculation before the order.


