Browse categories
Explore
Fiverr Pro
English
$
USD
We Provide Web Scraping Data Analytics and Amazon FBA Services
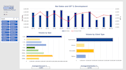
Expert Data Analysis, Visualization & Predictive Analytics Services
We are a team of professional data analysts offering top-tier data Interpretation services, data analysis, data visualization, & predictive analytics. Our expertise in Excel, Python, R, SQL, Power BI, and Tableau helps transform raw data into actionable insights that drive business growth & data driven decisions & Business Intelligence Reporting
Our Services:
Why Work With Us?
Tools: Python/R/Excel/Power BI/Tableau.
Contact us today to unlock the full potential of your data. Message us to discuss your project before ordering!


What type of data visualization services do you offer on your gig?
My data visualization gig covers a wide range of services including creating visually appealing dashboards, pivot tables, and charts to help clients understand their data. We also offer data analysis and KPI analysis to provide clients with insights and trends.
Can you help me create a dashboard to display my data?
Yes, I can help you create a visually appealing dashboard to display your data and make it easy to understand. We can also provide insights and trends based on the data.
Can you perform KPI analysis and provide me with visualized results?
Yes, I can perform KPI analysis and provide you with visualized results in the form of charts and pivot tables to help you understand the key performance indicators of your business.
Can you help me with creating pivot tables?
Yes, I have extensive experience in creating pivot tables to help you better understand your data. I can also provide insights and trends based on the pivot tables.
How long does it take to complete a data visualization project?
The time it takes to complete a data visualization project depends on the complexity of the project and the amount of data that needs to be analyzed. I provide an estimated completion time during the initial consultation and keep clients updated on our progress throughout the project.
Can you help me with qualitative data analysis?
Yes, I can help you with qualitative data analysis and provide you with visualized results to help you understand the findings.
Can you automate some of the data visualization process?
Yes, I can automate some of the data visualization processes, such as updating the data and creating charts, pivot tables, and dashboards.
Do you offer any guarantees for your data visualization services?
Yes, I offer a satisfaction guarantee. If you are not satisfied with the visualization, I will work with you to make revisions until you are happy with the final product.
What tools do use for Analysis
We usually ask the clients their tool requirements. We mostly offer Python, R Studio, Excel, Google Sheets, Tableau, and Google Looker Studio


