Browse categories
Explore
Fiverr Pro
English
$
USD

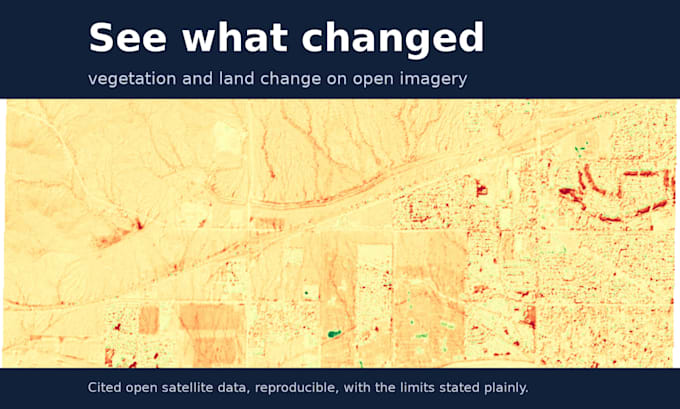
You want to know how an area changed between two dates: vegetation lost or gained, land cleared or developed, before and after a fire or a flood.
I pull open satellite imagery (Sentinel-2 at 10 m, or Landsat for history back to the 1980s), choose same season low cloud scenes so clouds and seasonality do not fake a result, coregister them, and measure the change in real units. You get a clear change map, the changed area in hectares and percent, the exact scene dates, and the limits stated plainly (for example, in dry country vegetation index also tracks rainfall, not only land change).
This is defensible remote sensing on cited open data, fully reproducible, not a black box. Send me the area (a bounding box or a place) and the two dates and I will tell you what the imagery can honestly support.
Senior Engineer: Geospatial, Data and Automation
Languages
Can you tell me exactly what was built?
Vegetation index change is a proxy, not a land use label. I flag the sharp, real land changes and separate them from broad seasonal or rainfall effects; a full land use classification is a larger scope I can quote.
How current can it be?
Sentinel-2 revisits every few days; I can usually get a recent low cloud scene.
