Browse categories
Explore
Fiverr Pro
English
$
USD
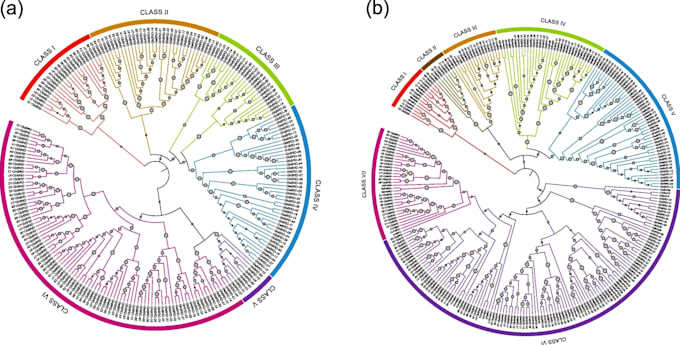
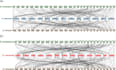
Transform Your Scientific and Bioinformatics Data into Clear, Insightful Visualizations
Are you struggling to make sense of complex scientific or bioinformatics data? Do you want your research findings, genomic analyses, or experimental results presented in a way that is not only accurate but visually compelling? Youve come to the right place! I specialize in transforming raw, complex datasets into clear, insightful, and publication-ready visualizations tailored to researchers, academicians, and organizations worldwide.
With years of experience in molecular biology, plant biology, genome editing, and bioinformatics, I bring a unique combination of scientific expertise and data visualization skills. Whether you are looking to illustrate gene expression patterns, comparative genomics results, or any other biological data, I can help you communicate your findings effectively.
What I Offer


How do I send you my data?
You can share your dataset via Excel, CSV, TXT, or any standard format. If your files are large, we can use cloud services like Google Drive or Dropbox. I ensure strict confidentiality of your data.
Do you help with data analysis as well?
Absolutely. I can preprocess your data, perform quality checks, normalize datasets, and conduct statistical analyses. I ensure your visualizations accurately reflect the results and insights of your data.
Can you combine multiple datasets into a single visualization?
Yes, I can integrate and visualize multiple datasets together, providing a comprehensive view of your results while maintaining clarity and precision.