Browse categories
Explore
Fiverr Pro
English
$
USD
Full Stack MERN Developer React, Node MongoDB Expert
Are you looking for a professional sales data analysis dashboard that turns your raw CSV or Excel data into powerful visual insights?
I will build you a full-stack interactive dashboard using Python (FastAPI + Pandas) on the backend and React with Recharts on the frontend.
--- WHAT YOU GET ---
Upload any CSV or Excel sales file
Auto-detects your columns (date, product, revenue, region, etc.)
Live KPI cards Total Revenue, Orders, Avg Order Value, Units Sold
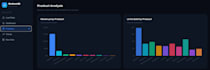
Monthly revenue trend charts (line & area charts)
Top-selling products ranked by revenue
Category and regional breakdowns
Month-over-month growth analysis
Data quality report (nulls, duplicates, date range)
Searchable raw data table
Clean dark-themed professional UI
--- TECH STACK ---
Backend: Python, FastAPI, Pandas, NumPy
Frontend: React 18, Vite, Recharts, Lucide Icons
File Support: CSV, XLSX, XLS
--- HOW IT WORKS ---
1. You send me your dataset (or I use a demo dataset)
2. I build and configure the full dashboard
3. I deliver the complete source code + setup instructions


What file formats do you support?
I support CSV, XLSX, and XLS files. As long as your file has a date column and a revenue or sales column, the dashboard will work automatically.
Do I need to have Python or React installed?
For the Basic package, no — I deliver a hosted or fully configured version. For Premium, I include full setup instructions so you can run it locally in minutes.
Can you use my real business data?
Yes! Just send me your dataset privately via Fiverr message. Your data is kept 100% confidential and never shared.
Can you add custom charts or features?
Absolutely. Message me before ordering and I'll let you know if it's covered or needs a custom offer.


