Browse categories
Explore
Fiverr Pro
English
$
USD



Still rebuilding the same sales report by hand every week?
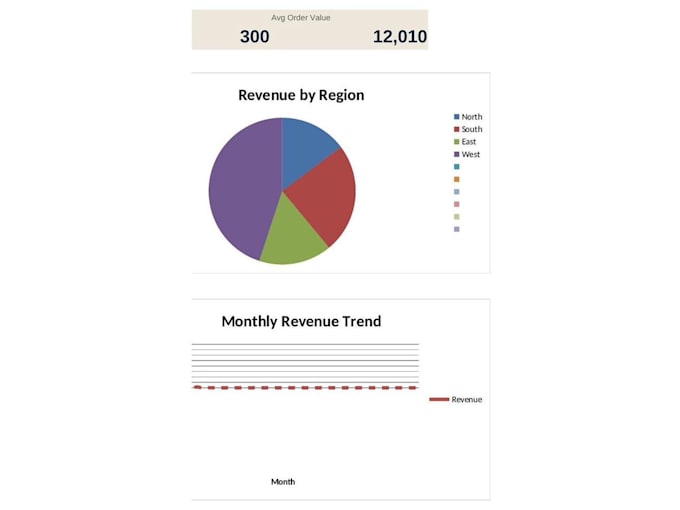
I will build you an Excel dashboard that updates itself. You paste your raw sales rows into one tab, and the category, region, product and month breakdowns rebuild automatically - along with the charts and KPI cards. No pivot tables to refresh, no lists to retype, no broken formulas.
WHAT YOU GET
- Raw Data tab set up for your exact columns
- Auto-detecting breakdown tables (category, region, product, month)
- Top 5 products table that re-ranks itself as data changes
- Dashboard tab with KPI cards and charts
- Instructions tab so anyone on your team can run it
- Works on Excel 2007 and above. No macros, no add-ins.
WHY ME
Google Certified Data Analyst, MBA in Business Analytics, 3+ years in MIS and BI reporting. I rebuilt a daily reporting process that took 3-4 hours into a 5-minute paste-and-done workflow.
HOW IT WORKS
1. Send a sample of your data (10-20 rows is enough)
2. Tell me the numbers you need to see
3. I build, test and deliver with a short walkthrough
Not sure which package fits? Message me first and I will tell you honestly.
Data MIS Analyst Power BI Excel Automation
Languages
Will this work on my version of Excel?
Yes. I avoid Excel 365-only functions like UNIQUE and FILTER, so the file runs on Excel 2007 and later, on both Windows and Mac.
Do I have to share confidential sales data?
No. Send 10-20 sample rows with the same column structure and I will build around that. You paste your real data in afterwards.
What happens when I add new products or categories later?
That is the whole point. Paste the new rows and every table, ranking and chart updates on its own. Nothing to maintain.
Can you build this in Power BI or Google Sheets instead?
Yes. Google Sheets is available as a gig extra. For Power BI, message me and I will quote it separately.