Browse categories
Explore
Fiverr Pro
English
$
USD

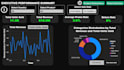
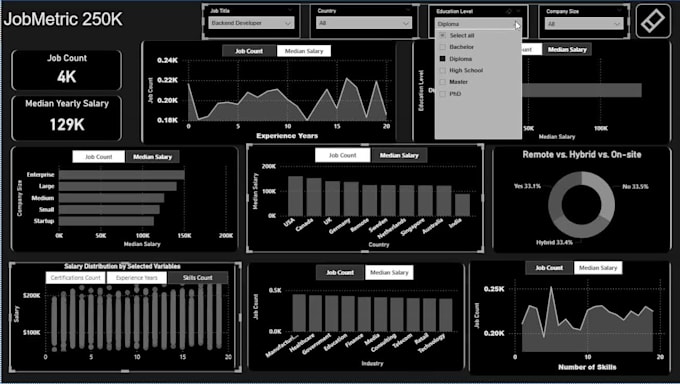
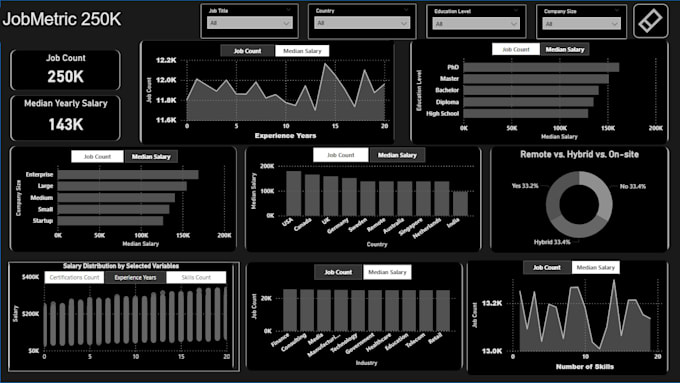
Power BI Data Visualization & Analytical Dashboards :
I will transform your data into clear, interactive, and insightful dashboards using Microsoft Power BI.
My goal is not only to create visually appealing charts, but also dashboards that help answer real analytical questions and support better decision-making.
Data Cleaning & Preparation :
Before visualization, data must be reliable. I clean and prepare datasets using Power Query, Python with Pandas, or SQL.
This includes fixing inconsistencies, handling missing values, formatting data, and preparing it for analysis.
Data Modeling :
I design efficient models using Star Schema, proper relationships between tables, and structured fact and dimension tables.
DAX Calculations :
I create custom calculations using DAX (Data Analysis Expressions), including KPIs, aggregations, time intelligence metrics, and analytical measures.
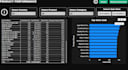
Interactive Dashboards :
I build dashboards with dynamic filters, slicers, drill-down analysis, and clear visualizations.
These dashboards are designed not only for visualization but also for analytical exploration and answering business questions, helping you turn raw data into meaningful insights.
data analyst
Languages
What do you need from me to start the project?
To start, provide either your dataset for a new Power BI dashboard, or an existing .pbix file to modify or extend. If it uses external data, include access. Also share a brief description of your goals and key questions for the dashboard.
Can you redesign or improve an existing Power BI dashboard?
Yes. I can optimize existing dashboards, and redesign the visuals for better clarity and analysis
Can you clean and prepare my data before building the dashboard?
Yes. I clean and prepare your data using Power Query, or Python with Pandas, or SQL to ensure the dataset is ready for analysis.