Browse categories
Explore
Fiverr Pro
English
$
USD


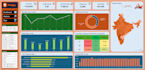

I will create a professional and interactive MS Excel dashboard to analyze your Swiggy or food delivery sales data. This dashboard allows you to track total sales, total orders, ratings, average order value, food type performance, state-wise sales, and daily, weekly, monthly and quarterly trends in one clean and easy-to-use report.
Using advanced Excel features like Pivot Tables, Power Query, formulas, slicers and dynamic charts, I will convert your raw data into meaningful business insights. You can easily filter by month, restaurant, category and location to identify your best performing items, cities and time periods.
This solution is ideal for restaurant owners, cloud kitchens, food delivery partners and business analysts who want to improve decision making, spot growth opportunities and increase revenue.
You will receive a fully interactive Excel file that is easy to update, visually clear and ready for business reporting or presentations. Lets turn your Swiggy data into powerful insights that help you grow your business.
Data Analyst
Languages


