#My GitHub https://github.com/Vivivikk/Analysis.git
I will create high-end Python dashboards to visualize your business or financial data. Using Pandas, Matplotlib, and Seaborn, I transform messy spreadsheets into presentation-ready reports.
What you get:
- BASIC: Essential Data Insight ($25)
- Automated script for fast data processing.
- Calculation of 3 core metrics (e.g., Min/Max, Averages, Returns).
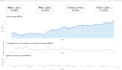
- 2 clean charts (Trend and Volume/Distribution).
- Simple, effective visual layout.
- STANDARD: Professional Business Dashboard ($40)
- Advanced OOP-based dashboard (reusable code).
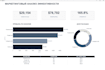
- 5 Premium KPI Cards for high-level metrics (ROI, Profit, etc.).
- 3 complex visualizations (Comparison, Share, and Performance).
- Full data cleaning and professional "C-level" design.
What I need from you (Requirements):
To get started, please provide:
- Your Data File: CSV or Excel format (e.g., client_data.xlsx or stocks.csv).
- Clear Objectives: List the specific metrics you want to track (e.g., "I need to see ROI per platform" or "Stock volatility").
- Preferences: Any specific color scheme or branding requirements.