Browse categories
Explore
Fiverr Pro
English
$
USD



Hello and welcome! I'm Wazir Aman, a skilled Data Analyst and computer science student specializing in data cleaning, analysis, visualization, trends, and reporting. If you're looking for someone to transform raw data into actionable insights through professional analysis and interactive visualizations, you're in the right place!
Services I Offer:
Tools:
Why choose me?
So, contact me now to discuss your project and see how I can help!
Data Entry, Data Enrichment, PDF Conversion, Excel, Copy Paste Work
Languages
1. What types of data visualizations can you create?
I can create a wide range of interactive and static visualizations, including: • Bar charts, line graphs • Scatter plots, and bubble charts • Advanced interactive visualizations • Time series animations and trend analysis visualizations If you have specific visualizations in mind, feel free to ask
2. Can you clean large datasets?
Yes, I specialize in cleaning datasets of all sizes. This includes: • Handling missing values, duplicates, and outliers • Converting data into usable formats • Removing irrelevant information • Standardizing data for analysis No matter the size or complexity, I ensure your data is ready for analysis
3. Can you create interactive visualizations that can be embedded in websites?
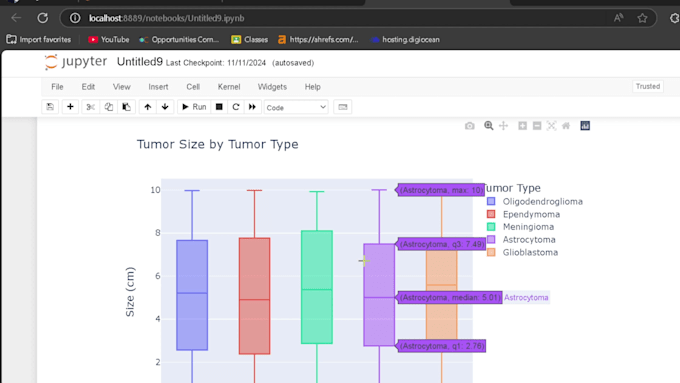
Absolutely! I can build interactive dashboards and graphs/charts using Plotly or Dash, which can easily be embedded into websites. These interactive visuals allow users to explore the data in real-time, such as filtering categories or zooming in on specific trends.
4. Do you offer data source connectivity?
Yes, I can connect your visualization or model to various data sources. This can include: • SQL databases • CSV files, Excel sheets • Google Sheets and API-based data Just provide the necessary credentials or dataset, and I’ll handle the rest!
5. What is the turnaround time for a project?
The turnaround time depends on the complexity of the task: • Basic data cleaning and visualizations: 1 day • Intermediate analysis with trend analysis and interactive charts: 2 days • Advanced analysis: 3 days
6. Can I request revisions after receiving the delivery?
Yes! Each package except basic includes revisions: • Basic: no revision • Standard: 1 revisions • Premium: 2 revisions
7. Do you offer predictive analysis or machine learning models?
While my main focus is on data cleaning, visualization, and trend analysis, I can also offer predictive analysis services using basic machine learning models like KNN, Linear Regression, and SVM for specific use cases.
8. How do you handle confidential or sensitive data?
Your privacy and data security are important to me. I ensure that: • All data is kept strictly confidential. • I follow any necessary data protection agreements. • Files will be deleted after project completion
9. What do I need to provide for you to start working on my project?
For me to begin, please provide: • Your dataset (in CSV, Excel, or any other preferred format). • Any specific requirements for visualizations or analysis (e.g., preferred charts etc). • A brief description of the project. The more details you provide, the better the results will be!