Browse categories
Explore
Fiverr Pro
English
$
USD
Stop guessing about your server health.
With 2+ years of DevOps experience, I build enterprise-grade monitoring & observability stacks using Prometheus, Grafana, Loki, and Datadog to detect issues before they impact your users.
I help startups and businesses gain full visibility across cloud, Kubernetes, and on-prem environments.
What I offer:
Why me?
Contact me before ordering to discuss your requirements.
Tools:
Kubernetes
•
Docker
•
Amazon EKS
•
Google Kubernetes Engine
Frameworks:
Npm
•
Terraform
•
Ansible
•
Chef
•
Puppet
Programming language:
Bash
•
Go
•
JavaScript
•
PHP
•
Python
•
Golang
Expertise:
Installation
•
Debugging
•
Configuration
Can you migrate my existing cloud alerts to a more cost-effective solution?
Yes, I can migrate your existing infrastructure alerts from any cloud provider to a self-managed Grafana setup. This migration can save you hundreds of dollars in monitoring costs while maintaining high visibility into your infrastructure.
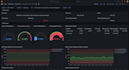
What do you monitor on the server?
I monitor RAM, CPU, Storage, Network Traffic, and Status Checks. I also set up 5 alerts for these metrics and configure email notifications if any thresholds are breached.
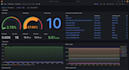
What Kubernetes issues can you monitor?
I offer extensive Kubernetes monitoring, including Node, Pod Failures, High CPU and Memory Usage, Disk Space Utilization, CrashLoopBackOff and ImagePullBackOff errors, Pending Pods, Certificate Expiry, Pod Evictions, Pod Restarts, Auto Node Addition, and ArgoCD Health and Sync and many more.
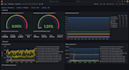
What kind of monitoring do you offer for Docker applications?
I provide comprehensive monitoring for Docker applications, including endpoint monitoring and tracking of specific port numbers. This ensures that your Docker environments are fully monitored for performance and availability.
Do you set up alerts for infrastructure monitoring?
Yes, I configure alerts for all monitored metrics, including server performance, Docker applications, and Kubernetes clusters. You'll receive email notifications whenever a threshold is breached or if any critical issue arises, ensuring you're always informed.


