Browse categories
Explore
Fiverr Pro
English
$
USD

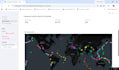
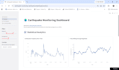
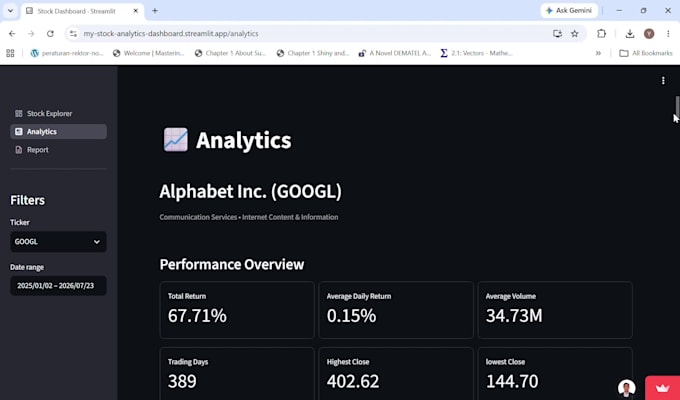
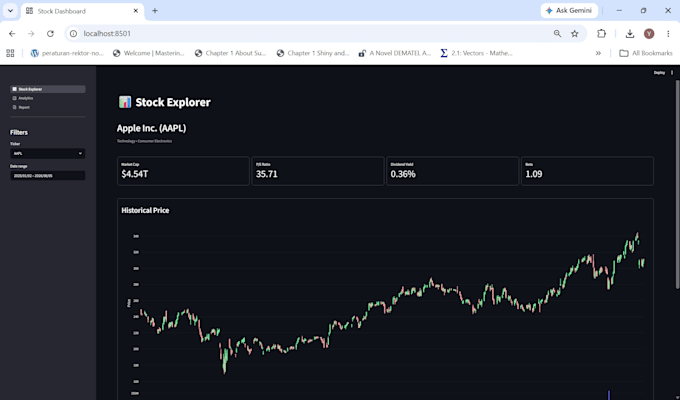
Looking for a professional and interactive dashboard to turn your data into clear, actionable insights?
I will build a Python Streamlit dashboard tailored to your data, workflow, and business requirements. Whether you have CSV/Excel files, a database, or an existing Python data pipeline, I can turn your data into an intuitive web-based dashboard.
What I can build:
I use Python, Streamlit, Pandas, Plotly, NumPy, SQL, and other data tools to create dashboards that are functional, responsive, and easy to understand.
Have a specific dashboard in mind? Send me your requirements or data before ordering, and I'll help determine the best approach for your project.
Python Analytics Engineer, Dash and Streamlit Dashboard Developer
Languages
What do you need from me to start the project?
I need your data or data source, dashboard requirements, preferred visualizations, KPIs, and any design references. If you are not sure what you need, send me your data and requirements and I can suggest a suitable dashboard structure.
What data sources can you work with?
I can work with common data sources such as CSV, Excel, SQL databases, APIs, and other structured data sources. Please contact me first if you have a specific data source or integration requirement.
Can you build multi-page Streamlit dashboards?
Yes. I can build multi-page Python Streamlit applications with navigation, interactive filters, KPIs, charts, tables, and other dashboard components.
Can you create custom charts and visualizations?
Yes. I can create custom interactive visualizations using Plotly and Altair based on your data and analytical requirements.
Can you connect the dashboard to my database or API?
Yes. I can integrate dashboards with supported databases and APIs. The exact implementation depends on your data source, authentication, and project requirements.
Can you deploy the Streamlit application?
Yes. Deployment is available for suitable projects. Please contact me before ordering if you need the dashboard deployed to a specific hosting platform or environment.
Can you build ETL and automate reporting?
Yes. ETL workflows, data processing, automation, and reporting are available as part of advanced projects, depending on the required workflow and data sources.
Can you work with an existing Python Streamlit project?
Yes. I can modify, improve, debug, or add features to an existing Streamlit application. Please send the project details and explain what you need changed before ordering.
Can you analyze my data and recommend the right charts?
Yes. If you provide the data and your objectives, I can recommend suitable KPIs, charts, filters, and analytical views based on the information you want to understand.