Browse categories
Explore
Fiverr Pro
English
$
USD


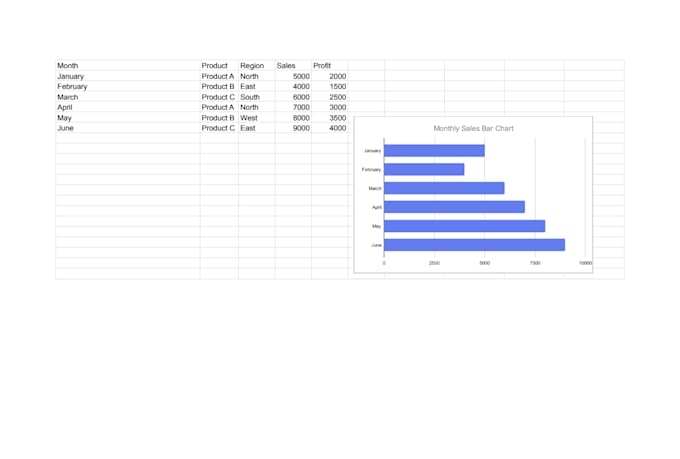
Do you have raw data but dont know how to make sense of it?
I will create an interactive Excel dashboard that visualizes your data using charts, KPIs, and summaries so you can understand trends and make better decisions.
What youll get:
Fully automated Excel dashboard
Charts, slicers, KPIs, and filters
Clean, professional layout
Quick delivery + friendly support
Perfect for:
️ Sales & finance tracking
️ Marketing & performance reports
️ Inventory management
Lets turn your data into insights
Languages
Q1: What if my data is messy?
No worries! I’ll clean and organize it before building your dashboard.
Q2: Do you need access to my original data?
You can share sample or dummy data if privacy is a concern.