Browse categories
Explore
Fiverr Pro
English
$
USD


Struggling to turn your microbiome or NGS data into clear, publication-ready figures? I create polished, reviewer-ready visualizations in R for researchers, ecologists, and bioinformaticians.
What I can create:
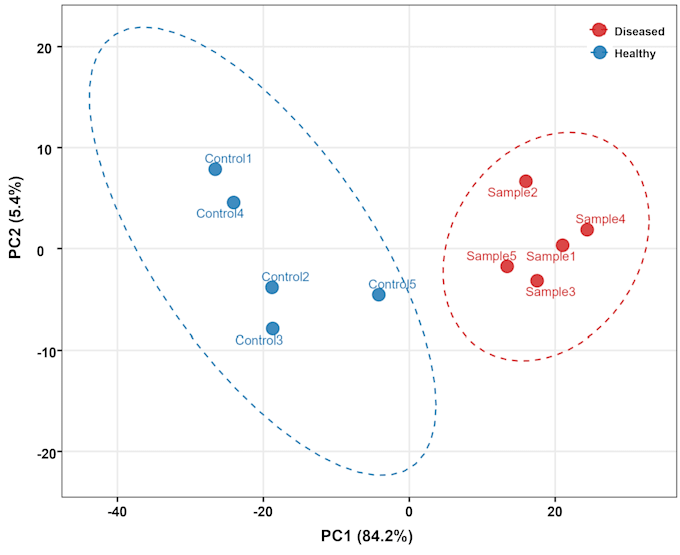
Diversity plots (alpha/beta diversity, PCoA/NMDS ordination)
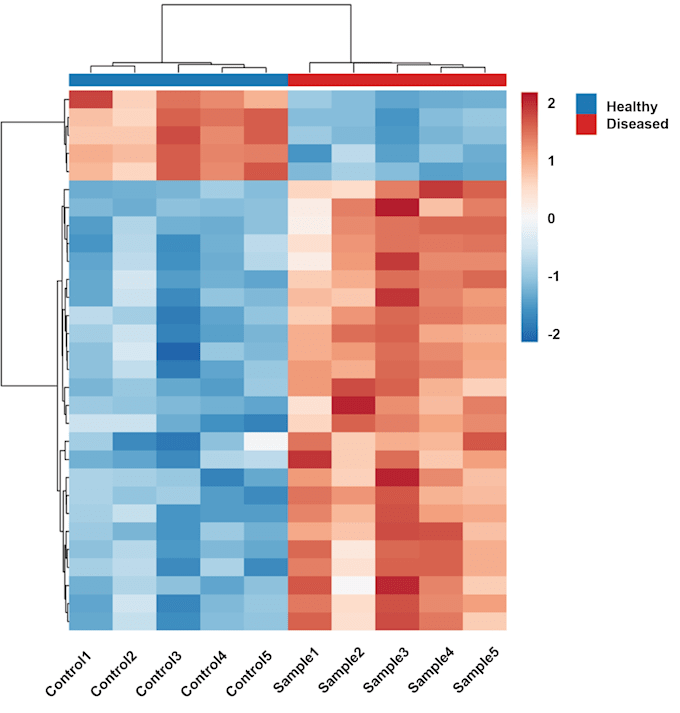
Relative abundance bar charts and heatmaps
Boxplots, PCA, and statistical comparison plots
Clean, journal-style formatting with your choice of color palette
Why work with me:
Strong R/ggplot2 background combined with a professional software engineering foundation (5+ years), so every script is clean, reproducible, and reusable
Fast, clear communication throughout the project
Revisions included, so the final figure matches exactly what you need for your paper, thesis, or report
Not sure which package fits your data? Message me your data type (16S, shotgun metagenomics, RNA-seq, etc.) and what you want to show, and I'll recommend the right option before you order.
Languages
What file format should I send my data in?
CSV, TSV, or Excel work best. I can also work directly with common outputs from QIIME2, phyloseq, DADA2, or other bioinformatics pipelines — just send whatever format you have and I'll let you know if any adjustment is needed.
What types of microbiome or NGS data do you work with?
16S rRNA amplicon sequencing, shotgun metagenomics, RNA-seq, and general ecological/community composition data. If you're not sure your data fits, message me before ordering and I'll confirm.
Can I request a specific color scheme or style to match my paper/thesis?
Yes. Let me know your preferred colors, journal style, or send an example figure, and I'll match it as closely as possible.
Will I receive the R script, or just the image files?
Both. Every order includes the high-resolution plot(s) plus the R script used to generate them, so you can reproduce or tweak the figures yourself later.