Browse categories
Explore
Fiverr Pro
English
$
USD


Review sales, inventory and operations data in a clear Excel dashboard.
As a former financial data analyst, I bring extensive Excel and database experience in recurring reports, reconciliation and formula checks.
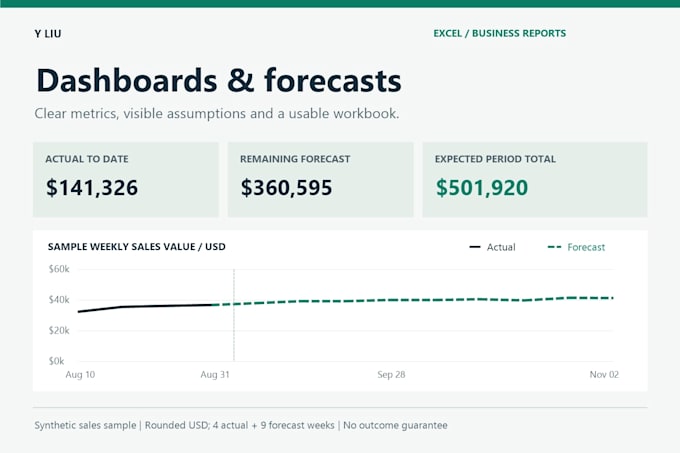
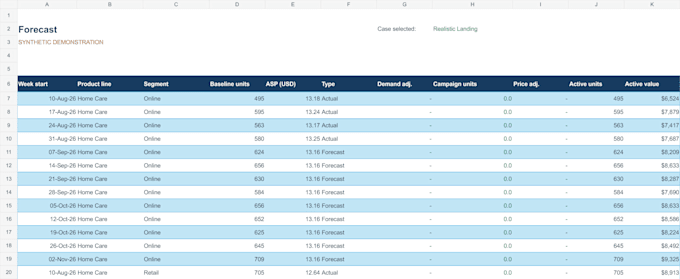
BASIC $75: one clean file/table, 500 rows, 20 columns, four KPIs and two charts on one dashboard sheet. Three days; static snapshot. STANDARD $150: three files/tables, 500 total rows, 20 columns, six KPIs, four charts and three preparation operations. One dashboard sheet with manual refresh instructions. Five days. PREMIUM $300: one CSV, up to four fixed sales series with 156 complete positive weeks each; max 624 rows and 10 columns. A 13-week forecast, two baseline methods, one holdout comparison, three scenarios, Excel summary and Python refresh. Seven days.
Includes metric/method notes and one revision within scope. Agree the software environment first. Forecasts express assumptions, not guaranteed outcomes. Returns, zero-sales series, complex calendars and live integrations are separately scoped. Non-financial projects only.
Samples use synthetic data. Send your dataset, KPI definitions and reporting period before ordering.
Excel Data Specialist and Python VBA SQL Automation
Languages
Which package includes forecasting?
Premium includes the defined weekly sales forecast. Basic is a completed KPI snapshot; Standard is a refreshable KPI dashboard. Premium is a distinct forecast scope and does not automatically combine every Standard feature. Send your data to confirm fit.
What input does the forecast require?
One CSV with up to four fixed series and 156 complete positive weekly observations per series, at most 624 total rows and 10 columns. Duplicate keys, missing weeks, returns and zero sales need review. Data outside this structure requires a separate scope.
Are forecast results guaranteed?
No. I document the method, historical holdout performance and scenario assumptions. Historical error is not a promise of future accuracy. Scenarios are planning assumptions, not calibrated probabilities. Synthetic portfolio results are not client results.
How does refresh work?
Standard uses a documented manual refresh for the agreed Excel environment and fixed input layout. Premium includes a Python script; you run it and open the updated workbook in the agreed spreadsheet engine. No schedule, file watcher or live connection is included.
Is data cleaning included?
Basic needs analysis-ready data. Standard includes three agreed preparation operations within its limits. Premium includes validation of the defined weekly structure. Substantial cleanup, fuzzy matching and outside research are separate tasks.
Can I request design changes?
One consolidated revision covers the original data, metrics, layout and agreed method. New metrics, sources, forecasting methods or software environments require a new scope. Errors against the agreed requirements are corrected.
Does the sample define the package scope?
The gallery is synthetic: 4 scenarios and a 13-week block with 4 actual + 9 forecast weeks. Premium includes 3 scenarios and 13 future weeks. Listed package limits apply. For Premium, '1 dashboard' means one Excel forecast summary.