Browse categories
Explore
Fiverr Pro
English
$
USD


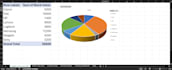
Are you looking for clear and professional data visualization in Excel to better understand your data?
You are in the right place.
I specialize in creating professional Excel charts and dashboards that transform raw data into meaningful visual insights. Whether you need simple charts or a structured dashboard, I will help you present your data in a clean and easy-to-understand format.
I work with business data, sales reports, inventory data, and other datasets to build effective Excel data visualization solutions that support analysis and decision-making.
My Services
Why Choose Me
Tools I Use
If you need Excel dashboards, charts, or data visualization, feel free to contact me before placing an order so we can discuss contact me.
Languages
What data formats do you accept?
I can work with multiple data formats including Excel (XLSX), CSV, Google Sheets, and other spreadsheet formats. Please share your dataset and I will transform it into professional charts or dashboards.
Can you create interactive Excel dashboards?
Yes. I can create interactive Excel dashboards with charts, pivot tables, filters, and slicers so you can easily analyze your data and gain clear insights.
What type of charts can you create?
I can create many types of Excel charts and data visualizations including bar charts, column charts, line charts, pie charts, KPI visuals, and business reporting charts.
Can you visualize business or sales data?
Yes. I regularly work with sales data, inventory data, business reports, and operational datasets to create clear and professional visual reports.
What if my data needs cleaning before visualization?
No problem. I can help with data cleaning, formatting, and structuring before creating the charts and visualizations to ensure accurate results.


