Browse categories
Explore
Fiverr Pro
English
$
USD

Hello!
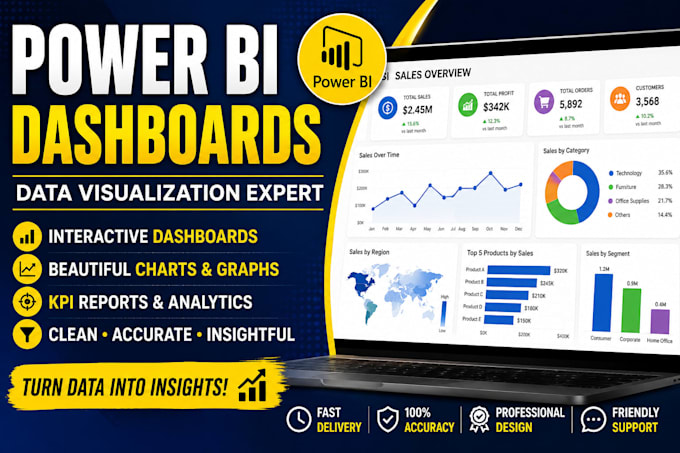
I will create professional, interactive, and visually appealing dashboards in Microsoft Power BI to help you understand your data better and make smarter business decisions.
What I Can Create:
Interactive dashboards
Charts & graphs
KPI reports
Sales dashboards
Financial reports
Marketing analytics dashboards
Data cleaning & transformation
Excel/CSV to Power BI reports
Custom visualizations
Why Choose Me?
Clean and modern dashboard design
Accurate data visualization
Fast delivery
Easy communication
100% client satisfaction
Tools I Use:
What You Need to Provide:
Please contact me before placing an order for complex projects.
Data Entry Specialist
Languages
What file formats do you accept?
Excel, CSV, SQL databases, Google Sheets, and other structured datasets.
Will the dashboard be interactive?
Yes, dashboards can include filters, slicers, drill-throughs, and dynamic visuals.
Can you clean messy data?
Yes, I can clean and transform raw data using Power Query.
Can you create custom charts?
Yes, custom visualizations and business-specific dashboards are available.
