Browse categories
Explore
Fiverr Pro
English
$
USD
AI Engineer , Data Analyst , 5 batches and 1000 students trained
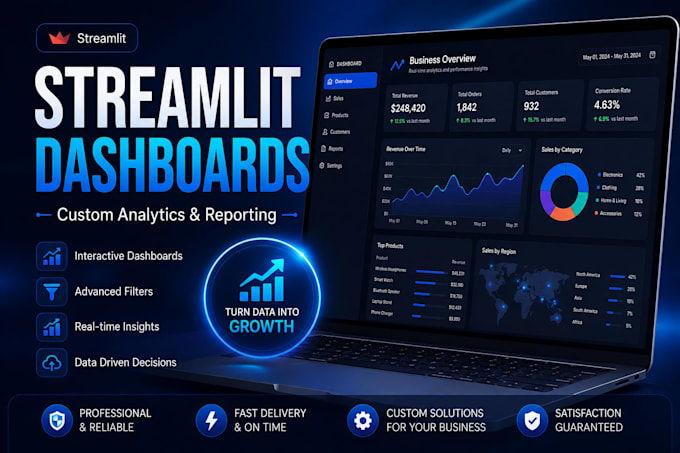
Turn Your Raw Data Into a Powerful, Interactive Dashboard
Are you sitting on spreadsheets full of data but no clear way to see
the story behind it? I help businesses, startups, and researchers turn
messy data into clean, interactive Streamlit dashboards that make
decision-making fast and visual.
WHAT I OFFER:
- Custom Streamlit web app development
- Interactive charts with Plotly (bar, line, 3D, heatmaps, etc.)
- Data cleaning & preprocessing (Pandas, NumPy)
- KPI cards, filters, and multi-tab navigation
- Advanced analytics: PCA, time series decomposition, outlier detection
- Export features (CSV/Excel/PDF)
- Cloud deployment so you can share a live link with your team
️ TOOLS & TECH:
Python | Streamlit | Pandas | Plotly | Matplotlib | Scikit-learn |
NumPy | Excel/CSV/JSON/SQL data sources
WHY WORK WITH ME:
I'm an AI & Data Science trainer who has built and deployed multiple
production-grade dashboards, including a 54,600-row sports analytics
platform with 3D visualizations and real-time filtering. I don't just
make charts I build data products that make your numbers actually
useful.
Send me your dataset or a message describing your project, and I'll get back to you


What if I need extra charts or features beyond the package?
No problem — just message me before ordering with your full requirements and I'll recommend the right package or a custom offer.
How many revisions do I get?
1/2/3 revisions depending on your package (see package details above). Additional revisions can be arranged if scope changes.
Will I receive the source code?
Yes, source code is included in Standard and Premium packages. Basic includes the working dashboard only.
What format should my data be in?
CSV, Excel (.xlsx), JSON, or SQL exports all work. If your data needs heavy cleaning first, let me know in advance — I can quote that separately or include it.
Can you deploy the dashboard online so I can share a live link?
Yes, on the Premium package I deploy to Streamlit Cloud (or similar) and give you a shareable link.
Do you sign an NDA for sensitive business data ?
Absolutely — happy to sign an NDA before you share any data.