Browse categories
Explore
Fiverr Pro
English
$
USD

Professional Data Visualization Services with D3.js | Custom Interactive Charts & Dashboards | Seamless Integration
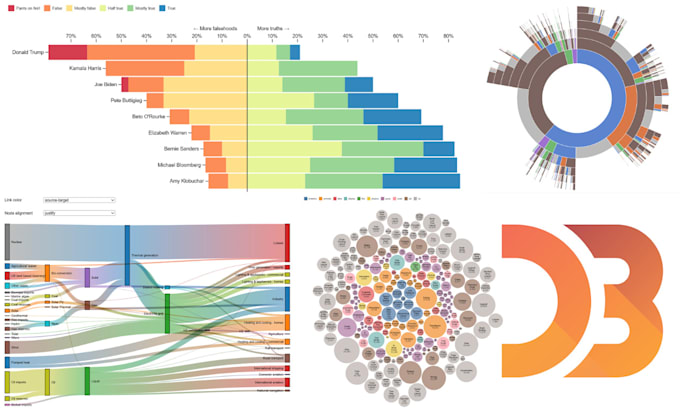
Are you looking to turn your raw data into stunning, interactive visualizations that captivate your audience? Look no further! I am a professional D3.js developer with years of experience creating custom data visualizations, interactive dashboards, and dynamic charts for businesses, researchers, and developers. Whether you need to visualize data for your website, app, or research project, I've got you covered!
Custom Data Visualizations: Bar charts, line graphs, scatter plots, pie charts, heatmaps, network graphs, and more.
Interactive Dashboards: Real-time, responsive dashboards with filters, tooltips, and zooming features.
Seamless Integration: Integrate D3.js visualizations into your React, Angular, Vue.js, or plain JavaScript projects.
Data Storytelling: Create narrative-driven visualizations to present your data in a compelling way.
Research Visualizations: Visualize complex datasets for scientific, or business research.
D3.js Developer, Data Visualization, Interactive Dashboards, Custom Charts, Data Storytelling, D3.js Integration, Real-Time Visualizations
Python Developer , Data Visualization , Dashboards , Web Automation
Languages
